Source and Methodology
Since 2007, the Appalachian Regional Commission (ARC) has used an index-based county economic classification system to identify and monitor the economic status of Appalachian counties. The system involves the creation of a national index of county economic status through a comparison of each county’s averages for three economic indicators—three-year average unemployment rate, per capita market income, and poverty rate—with national averages. The resulting values are summed and averaged to create a composite index value for each county. Each county in the nation is then ranked, based on its composite index value, with higher values indicating higher levels of distress.
County Economic Levels
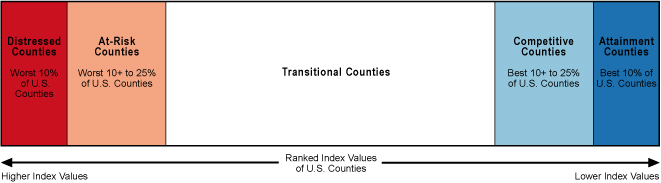
Each Appalachian county is classified into one of five economic status designations, based on its position in the national ranking.
Distressed
Distressed counties are the most economically depressed counties. They rank in the worst 10 percent of the nation’s counties.
At-Risk
At-Risk counties are those at risk of becoming economically distressed. They rank between the worst 10 percent and 25 percent of the nation’s counties.
Transitional
Transitional counties are those transitioning between strong and weak economies. They make up the largest economic status designation. Transitional counties rank between the worst 25 percent and the best 25 percent of the nation’s counties.
Competitive
Competitive counties are those that are able to compete in the national economy but are not in the highest 10 percent of the nation’s counties. Counties ranking between the best 10 percent and 25 percent of the nation’s counties are classified competitive.
Attainment
Attainment counties are the economically strongest counties. Counties ranking in the best 10 percent of the nation’s counties are classified attainment.
ARC County Economic Status Designation by National Index Value Rank
County Economic Indicators
Three–Year Average Unemployment Rate
The three-year average unemployment rate is a measure of long-term structural unemployment. The unemployment rate is calculated by dividing the three-year sum of persons unemployed by the three-year sum of the civilian labor force and expressing the result as a percentage.
Source: U.S. Department of Labor, Bureau of Labor Statistics, Local Area Unemployment Statistics. https://www.bls.gov/lau/home.htm
Per Capita Market Income
Per capita market income is calculated by dividing total personal income, less transfer payments, by population. Transfer payments include retirement and disability insurance benefit payments, medical payments, income maintenance benefit payments, unemployment insurance benefit payments, veterans benefit payments, and other such payments.
Note: The Bureau of Economic Analysis accelerated the release schedule of its income data in the year between ARC’s FY 2014 and FY 2015 county economic status designations, which allowed ARC to increase the currency of the income indicator by two years, instead of by one year.
Source: U.S. Department of Commerce, Bureau of Economic Analysis, Local Area Personal Income. https://www.bea.gov/data/income-saving/personal-income-county-metro-and-other-areas/
Poverty Rate
The poverty rate is computed by dividing the number of persons living below the poverty threshold by the number of persons for whom poverty status has been determined.
Note: Five-year poverty estimates from the U.S. Census Bureau’s American Community Survey were first used in the fiscal year 2012 county economic status designations. The decennial census no longer produces poverty data. A five-year estimate provides the most reliable and comparable data for all U.S. counties, particularly those with small populations. A new five-year poverty estimate will be incorporated into the county designations each fiscal year.
Source for Fiscal Years 2012–2024: U.S. Department of Commerce, Census Bureau, American Community Survey 5-Year Estimates. https://www.census.gov/programs-surveys/acs/
Source for Fiscal Years 2007–2011: U.S. Department of Commerce, Census Bureau, Census of Population and Housing 2000 Summary File 3. https://www.census.gov/topics/income-poverty/poverty.html
Time Series
ARC computes new county economic levels each fiscal year based on the most current data available at the beginning of the calendar year of computation. The time series used for each economic indicator and fiscal year is listed in the table below.
Note: The number of U.S. counties in the index was restored to 3,113 in FY 2022. The number of U.S. counties was reduced by one, for a total of 3,112 in FY 2021, due to a Census Bureau poverty data collection error in Rio Arriba County, NM. The number of U.S. counties increased from 3,110 in FY 2016 to 3,113 in FY 2017 due to geographic changes in the three federal source databases (U.S. Bureau of Labor Statistics, U.S. Bureau of Economic Analysis, and U.S. Census Bureau).
| Fiscal Year | Three-Year Average Unemployment Rate | Per Capita Market Income | Poverty Rate |
| 2024 (Effective Oct. 1, 2023-Sept. 30, 2024 | 2019-2021 | 2021 | 2017-2021 |
| 2023 (Effective Oct. 1, 2022–Sept. 30, 2023) | 2018-2020 | 2020 | 2016-2020 |
| 2022 (Effective Oct. 1, 2021–Sept. 30, 2022) | 2017-2019 | 2019 | 2015-2019 |
| 2021 (Effective Oct. 1, 2020–Sept. 30, 2021) | 2016-2018 | 2018 | 2014-2018 |
| 2020 (Effective Oct. 1, 2019–Sept. 30, 2020) | 2015-2017 | 2017 | 2013-2017 |
| 2019 (Effective Oct. 1, 2018–Sept. 30, 2019) | 2014-2016 | 2016 | 2012-2016 |
| 2018 (Effective Oct. 1, 2017–Sept. 30, 2018) | 2013-2015 | 2015 | 2011-2015 |
| 2017 (Effective Oct. 1, 2016–Sept. 30, 2017) | 2012-2014 | 2014 | 2010-2014 |
| 2016 (Effective Oct. 1, 2015–Sept. 30, 2016) | 2011-2013 | 2013 | 2009-2013 |
| 2015 (Effective Oct. 1, 2014–Sept. 30, 2015) | 2010–2012 | 2012 | 2008–2012 |
| 2014 (Effective Oct. 1, 2013–Sept. 30, 2014) | 2009–2011 | 2010 | 2007–2011 |
| 2013 (Effective Oct. 1, 2012–Sept. 30, 2013) | 2008–2010 | 2009 | 2006–2010 |
| 2012 (Effective Oct. 1, 2011–Sept. 30, 2012) | 2007–2009 | 2008 | 2005–2009 |
| 2011 (Effective Oct. 1, 2010–Sept. 30, 2011) | 2006–2008 | 2007 | 2000 |
| 2010 (Effective Oct. 1, 2009–Sept. 30, 2010) | 2005–2007 | 2006 | 2000 |
| 2009 (Effective Oct. 1, 2008–Sept. 30, 2009) | 2004–2006 | 2005 | 2000 |
| 2008 (Effective Oct. 1, 2007–Sept. 30, 2008) | 2003–2005 | 2004 | 2000 |
| 2007 (Effective Oct. 1, 2006–Sept. 30, 2007) | 2002–2004 | 2003 | 2000 |